
.NET 8 - ASP.NET Core Metrics
In this article, I'll show you the new built-in metrics of .NET 8, which are basically numerical measurements reported over time in your application and can be used to monitor the health of your application and generate reports according to those numerical values. We will see what the metrics are, why to use them, and how to use them in detail. So, let's dive in.
What are Metrics?
Metrics are numerical measurements reported over time. These measurements are crucial for monitoring the health of an application and generating alerts when necessary. In the context of a web service, various metrics can be tracked, such as:
- Requests per second.
- Response time.
- Status code counts etc...
These metrics are not just collected; they are reported to a monitoring system at regular intervals. By doing so, the development and operations teams can visualize these metrics on dashboards. These dashboards provide a real-time overview of the application's performance and health.
Pre-Built Metrics
ASP.NET Core has many built-in metrics. You can see the following figure for a list of built-in metrics for ASP.NET Core:
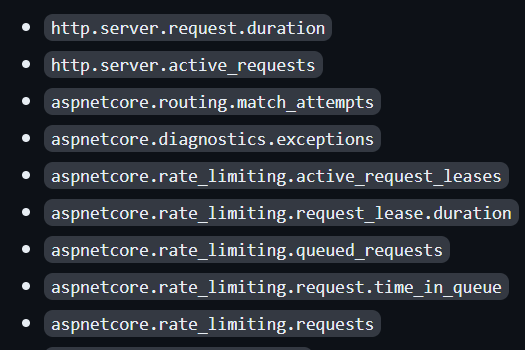
See https://learn.microsoft.com/en-us/dotnet/core/diagnostics/built-in-metrics-aspnetcore and https://github.com/dotnet/aspnetcore/issues/47536 for all built-in metrics and their descriptions.
For example, we have the kestrel-current-connections metric that shows the number of connections that are currently active on the server and the http-server-request-duration metric that shows the duration of HTTP requests on the server.
All of these and other built-in metrics are produced by using the System.Diagnostics.Metrics API and with a small amount of code, we can use & view them.
Using Pre-Built Metrics
Let's see the pre-built metrics in action.
Create a new ASP.NET Core app with the following command and change the directory to the created application folder:
dotnet new web -o MetricsDemo
cd MetricsDemo
After that, open the application in your favorite IDE and add the following service registration code to your application:
var builder = WebApplication.CreateBuilder(args);

builder.Services.AddOpenTelemetry()
    .WithMetrics(builder =>
    {
        builder.AddPrometheusExporter();

        builder.AddMeter("Microsoft.AspNetCore.Hosting",
            "Microsoft.AspNetCore.Server.Kestrel");
        builder.AddView("http.server.request.duration",
            new ExplicitBucketHistogramConfiguration
            {
                Boundaries = new double[] { 0, 0.005, 0.01, 0.025, 0.05,
                    0.075, 0.1, 0.25, 0.5, 0.75, 1, 2.5, 5, 7.5, 10 }
            });
    });
Here, we have done the following steps:
- The
AddOpenTelemetrymethod registers the required OpenTelemetry services into the DI container. - In the
WithMetricsmethod, we add pre-built metrics to theOpenTelemetryBuilderin theAddMetermethod (Microsoft.AspNetCore.Hosting and Microsoft.AspNetCore.Server.Kestrel are pre-built metrics provided by ASP.NET Core). - We have also used the
AddViewmethod to customize the output of the metrics by the SDK. It can also be used to customize which Instruments are to be processed or ignored.
After making the related configurations, let's add the middleware below and view the metrics:
app.MapPrometheusScrapingEndpoint();

app.MapGet("/", () =>
{
    Thread.Sleep(2000);

    return "Hello, ABP Community member: " + DateTime.Now.Ticks.ToString()[^3..];
});
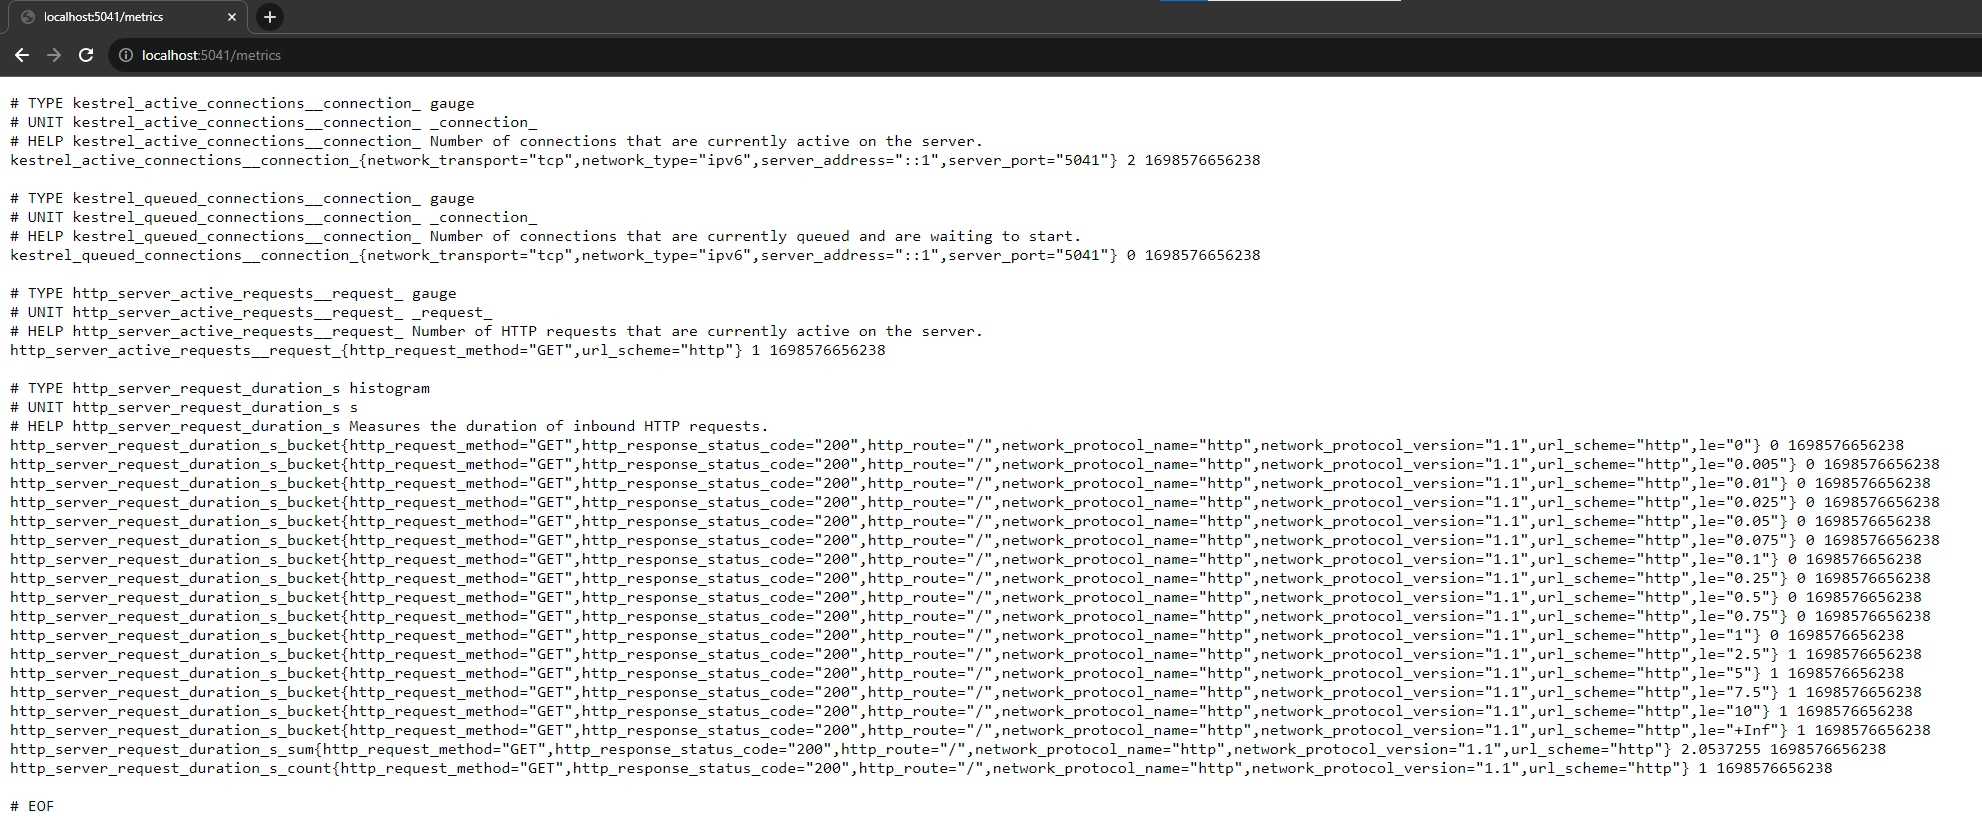
MapPrometheusScrapingEndpoint: Adds the OpenTelemetry Prometheus scraping endpoint middleware to the pipeline and then we can see the all metrics by navigating to the /metrics endpoints (optional):
View Metrics
You can use the dotnet-counters command-line tool, which allows you to view live metrics for .NET Core apps. You can run the following command to install the tool:
dotnet tool update -g dotnet-counters
After the tool is installed, you can run the application and by running the dotnet-counters tool in a terminal, you can monitor for the specific metrics:
dotnet-counters monitor -n MetricsDemo --counters Microsoft.AspNetCore.Hosting
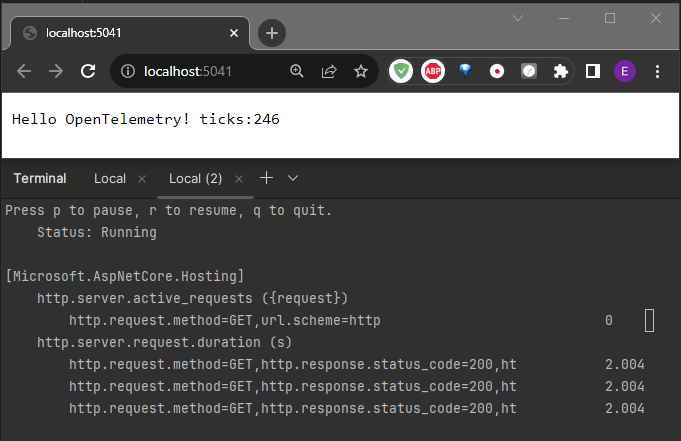
When you run the command, it will print a message like the one below and will wait for an initial request to your application:
Press p to pause, r to resume, q to quit.
    Status: Waiting for initial payload...
If you send a request to your application, then the related built-in metrics that you have added will be collected and will be shown in the terminal instantly:
Also, you can check for the other metric that we have used in the configuration, which is Microsoft.AspNetCore.Server.Kestrel by setting it as a counter as in the command below, and when you send a request to your application, you will see different metrics:
dotnet-counters monitor -n MetricsDemo --counters Microsoft.AspNetCore.Server.Kestrel
Creating Custom Metrics in ASP.NET Core Applications
So far, we have seen what metrics are, which built-in metrics are provided by ASP.NET Core, the use of the built-in metrics and running the dotnet-counters global tool to view these metrics. At this point, let's see how we can create custom metrics and view them via the dotnet-counters tool.
IMeterFactory is the recommended service to create Meter instances. ASP.NET Core registers the IMeterFactory in dependency injection (DI) by default. The meter factory integrates metrics with DI, making isolating and collecting metrics easy.
Assume that, we want to create a metric that holds the sold products in our application. For that purpose, as a first step, we can create a metric class as follows:
using System.Diagnostics.Metrics;

namespace MetricsDemo;

public class ProductMetrics
{
    private readonly Counter<int> _soldProductsCount;

    public ProductMetrics(IMeterFactory meterFactory)
    {
        var meterInstance = meterFactory.Create("MetricsDemo.ProductStore");
        _soldProductsCount = meterInstance.CreateCounter<int>("metricsdemo.productstore.sold_products_count");
    }

    public void IncreaseSoldProductCount(int quantity)
    {
        _soldProductsCount.Add(quantity);
    }
}
In this class, we are creating a counter and defining metrics that we want to collect and view. MetricsDemo.ProductStore is the counter name and metricsdemo.productstore.sold_products_count is the metric. In our example, we need to register this class with a Singleton lifetime because we don't want to reset the counter and want to keep it during the application runtime.
The System.Diagnostics.Metrics.Meter type is the entry point for a library to create a named group of instruments. Instruments record the numeric measurements that are needed to calculate metrics. Here we used CreateCounter to create a Counter instrument named metricsdemo.productstore.sold_products_count.
So, register the type with the DI container in the Program.cs file (or you can implement the ISingletonDependency interface, if you are using an ABP based application):
builder.Services.AddSingleton<ProductMetrics>();
Then, we can inject this class and increase the sold product count whenever it's needed. Since we have registered it in DI, we can use it in minimal APIs as in the following example:
app.MapPost("/complete-sale", ([FromBody] ProductSoldModel model, ProductMetrics metrics) =>
{
    // ... business logic such as saving the product to the database etc... ...

    metrics.IncreaseSoldProductCount(model.Quantity);
});
Whenever a request is made to this endpoint the metric that we've defined (metricsdemo.productstore.sold_products_count) will be increased and we can see this metric via the dotnet-counters global tool. You can run the following command to see the metrics:
dotnet-counters monitor -n MetricsDemo --counters MetricsDemo.ProductStore
Here is an example output that you would see if you have made a POST request to the /complete-sale endpoint:
Press p to pause, r to resume, q to quit.
    Status: Paused

[MetricsDemo.ProductStore]
    metricsdemo.productstore.sold_products_count (Count / 1 sec)          20
Advanced: View Metrics in Prometheus & Grafana - Building Dashboards
It's a common requirement to build a dashboard and monitor the metrics and check the health of your applications. At that point, you can expose the metrics and scrape them using the Prometheus and build a dashboard by using the Grafana.
If you want to build a dashboard, you can see this documentation from Microsoft, which shows how to set up the Prometheus server and show metrics on a Grafana dashboard.
Also, you can check this video if you want to see it in action.
Conclusion
In this article, I've shown you the new built-in metrics of .NET8, described what metrics are, which pre-built metrics are provided by ASP.NET Core, how to use & view these pre-built metrics and finally, I have shown you how to create custom metrics and view them in a dashboard. If you want to learn more about the Metrics System of .NET, you can check out the references that I have shared below.
Berkan Şaşmaz 23 weeks ago
Great article!
Engincan Veske 23 weeks ago
Thanks, great to hear that!